We pulled 50 Junior Data Analyst job postings in the US and extracted structured signals using an LLM.
If you're applying within 4–8 weeks (career switcher or new grad), this shows what to practice first.
This post is a snapshot of what showed up most often — and how to turn it into a practical 4–8 week prep plan.
The one-line summary
In this sample, “Junior DA” is mostly reporting + dashboards + data quality + light ETL — with a meaningful slice mentioning governance/compliance. The most common baseline requirements are communication + Excel/SQL + visualization/dashboarding, not advanced modeling.
Get a prep plan for your target job (2 min)
We turned this analysis into a simple flow:
- Paste 1–3 job posts
- Get must-have vs nice-to-have
- Get a 4–8 week plan + Week 1 deliverable
Methodology
- Data: 50 US "Junior Data Analyst"-level postings collected on Jan 22, 2026 (previous ~30 days).
- Sources: Public job boards + company career pages. We analyze aggregate signals and do not republish job description text.
- Extraction: An LLM maps each posting to a fixed schema (work types, skills, deliverables, eligibility constraints).
- Validation: Manual spot-check (n=5) showed ~0.8 average strict accuracy.
- Limitations: Not a random sample; results reflect these sources + query terms. LLM extraction can make mistakes; we constrain outputs with a schema and internal evidence checks, but it's still an approximation.
Note: percentages below are % of postings that mention an item (not “% of mentions”).
Filtering funnel
- Initial scrape: 3,870 postings (dedup primarily by URL + basic title/company/location checks)
- After title filter ("junior data analyst"-like): 71
- Final analysis set: 50, using:
- US-only location heuristic (location strings + non-US markers)
- Minimum description length
- Max 2 postings per company
- Removed staffing/recruiting duplicates + near-duplicates
- If >50 matched, selected most recent first
Required vs preferred
- Classified using section headers ("Required Qualifications" vs "Preferred Qualifications") + keyword patterns.
- When unclear, defaulted to "required" if in "must have/requirements" sections.
Query terms
- "junior data analyst", "junior data analytics", "junior BI analyst", "entry level data analyst", "associate data analyst"
Validation details
- Manual spot-check of 5 randomly sampled postings using a 10-item rubric (field-level checks for work mode, location constraints, education/experience, eligibility, skills, etc.).
- We score strict accuracy as: (rubric points earned) / 10, where items require explicit textual support and unsupported inferences count as errors.
Mean strict accuracy across the 5 audits was 79.0% (schema-adjusted: 80.3%).
Additional limitations
- Some postings don't specify domain or eligibility constraints clearly, so they appear as UNKNOWN (a small fraction in this sample for work mode, larger for visa sponsorship).
1. What kinds of junior DA roles are these?
Archetypes (share of postings):
- BI / reporting: 32%
- General analytics: 22%
- Ops analytics: 14%
- Healthcare analytics: 12%
- Finance / risk: 8%
- A small tail (4% each): configuration/data management, credit/loan ops analytics, sales analytics.
Archetype implications:
Different archetypes emphasize different metrics and datasets:
- Ops analytics: SLA/throughput/backlog metrics, operational efficiency datasets
- Healthcare analytics: Claims/encounters data with privacy-safe handling narratives
- Finance/risk: Reconciliations, controls, auditability-focused datasets
- BI/reporting: Executive dashboards, KPI tracking, standardized reporting pipelines
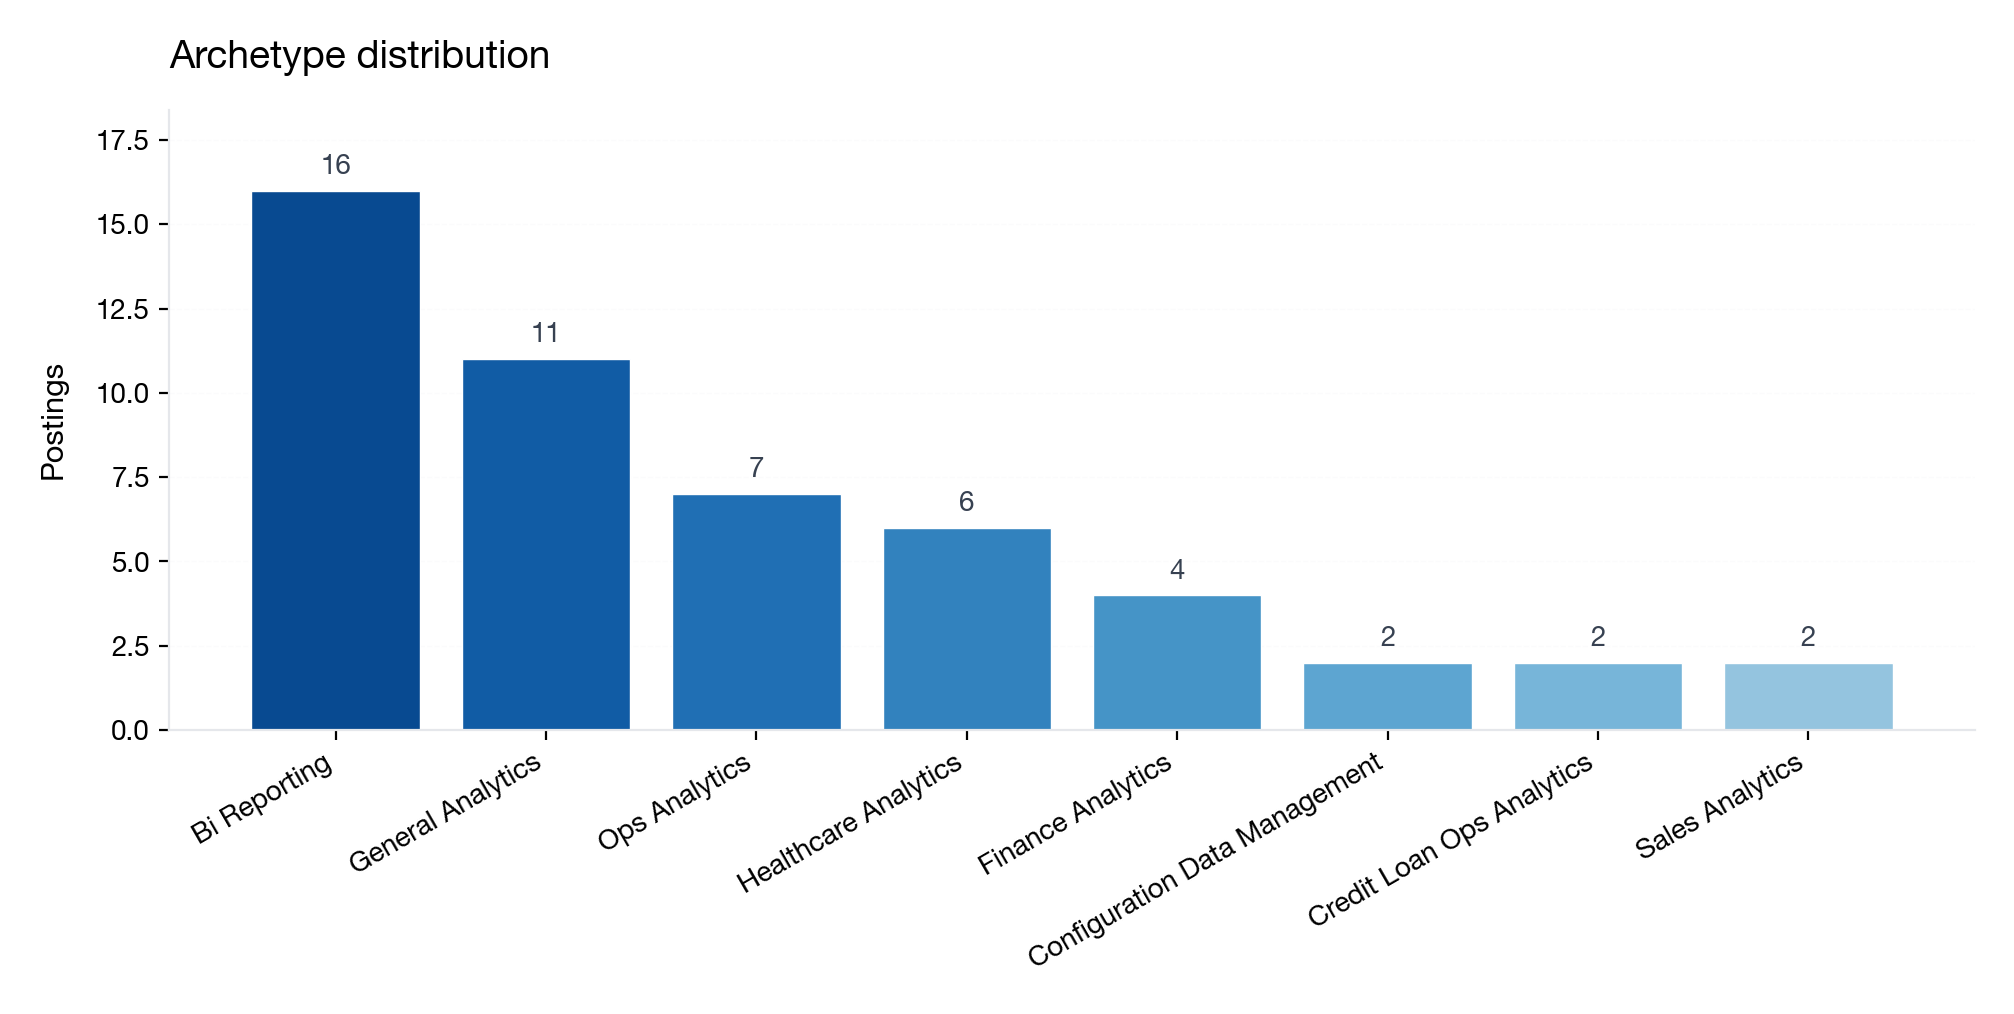
Distribution of role archetypes
2. What work do these roles actually do?
Each posting can include multiple work types. post_share = % of postings that mention the type.
Top analysis types mentioned:
- Reporting: 92%
- Data quality: 74%
- Exploratory analysis: 66%
- Dashboards: 64%
- Light ETL: 56%
- Data governance / compliance: 38%
- Change control: 6%
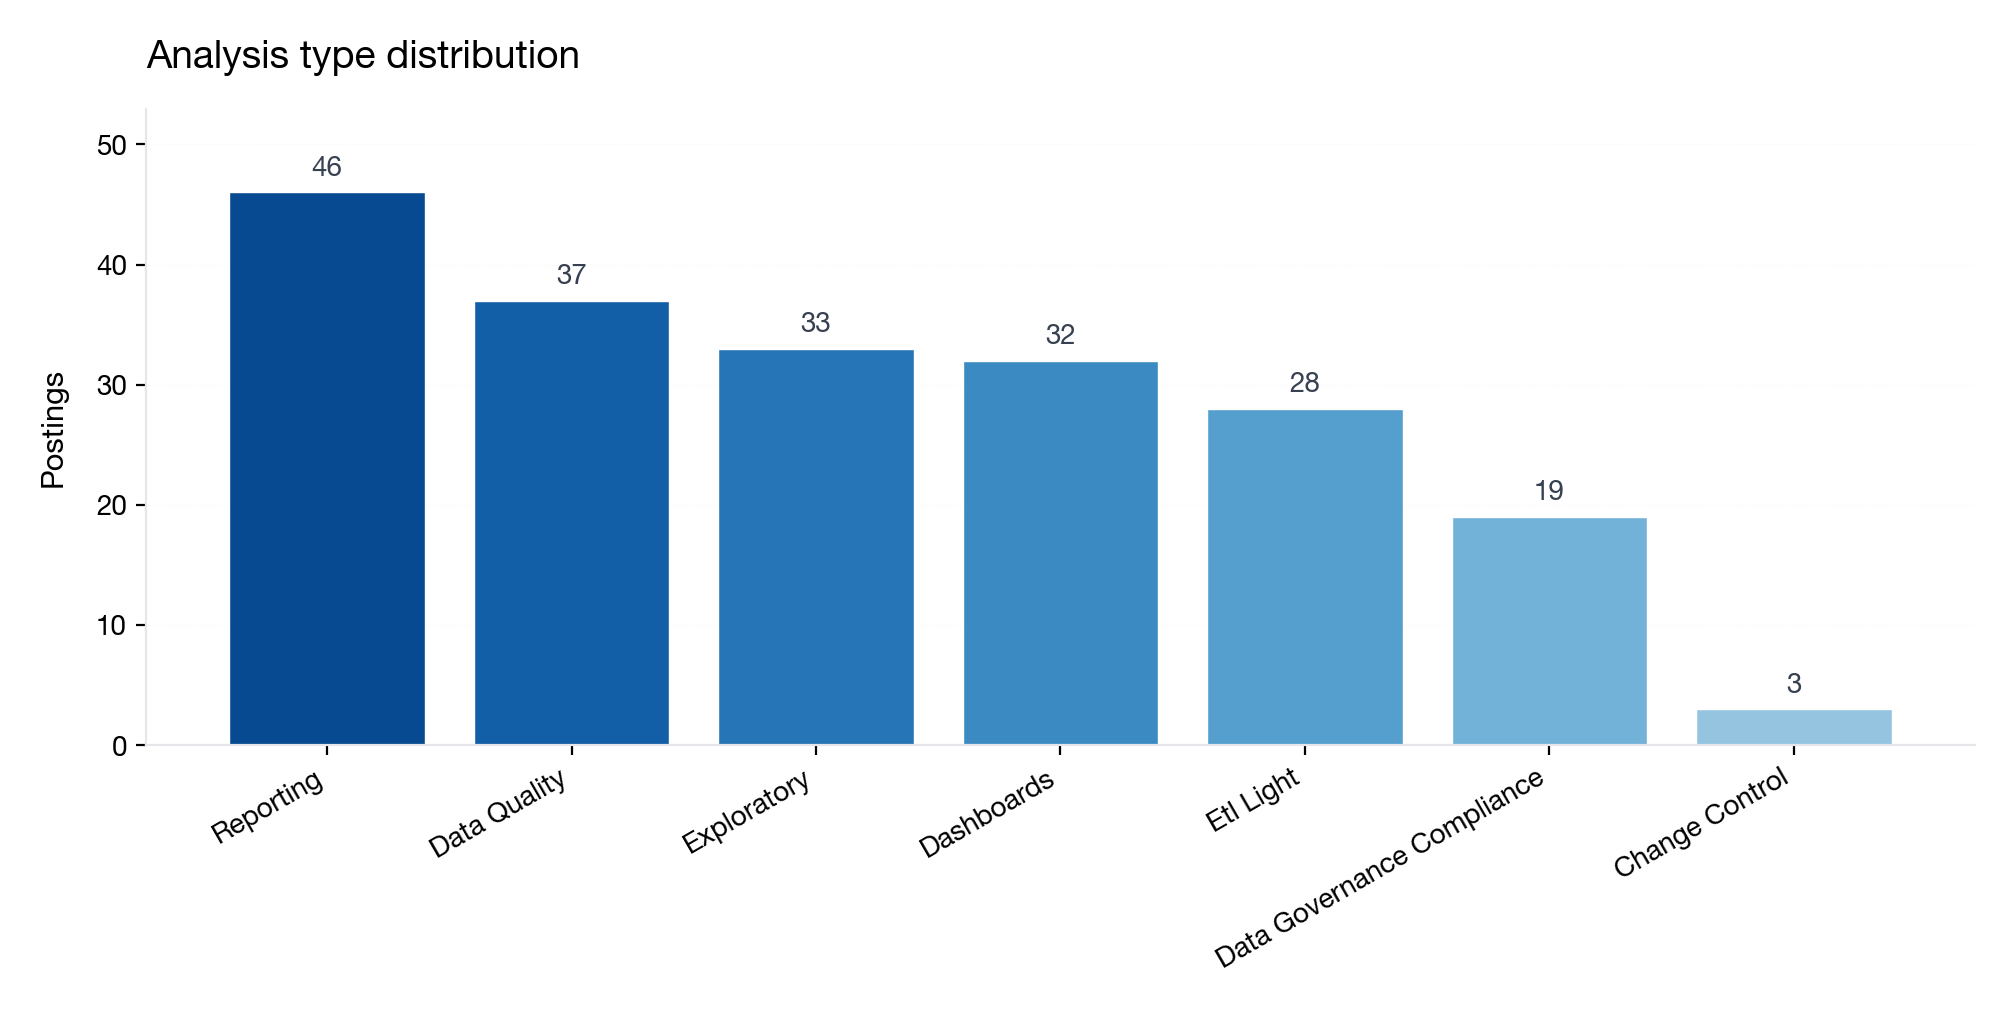
Most common analysis types
Interpretation: If your plan is “learn a bit of everything,” this is why it feels blurry. The typical junior DA job is closer to shipping reliable reporting outputs (with QA + practical ETL) than doing advanced modeling.
What to deprioritize (if you have 4 weeks): In this sample, advanced analytics themes were not emphasized compared to reporting/QA/dashboarding. If you're time-boxed, prioritize reporting + data quality + dashboards + practical ETL first, then add Python/stats depth later.
What this means for your prep
- If you have 4 weeks: Reporting + QA + dashboards + ETL.
- If you have 6–8 weeks: add Python + stats + a domain-tailored project.
- If remote-only: expect a much smaller pool in this sample.
3. Skills employers mention most (required vs preferred)
Counts are post-level (once per posting).
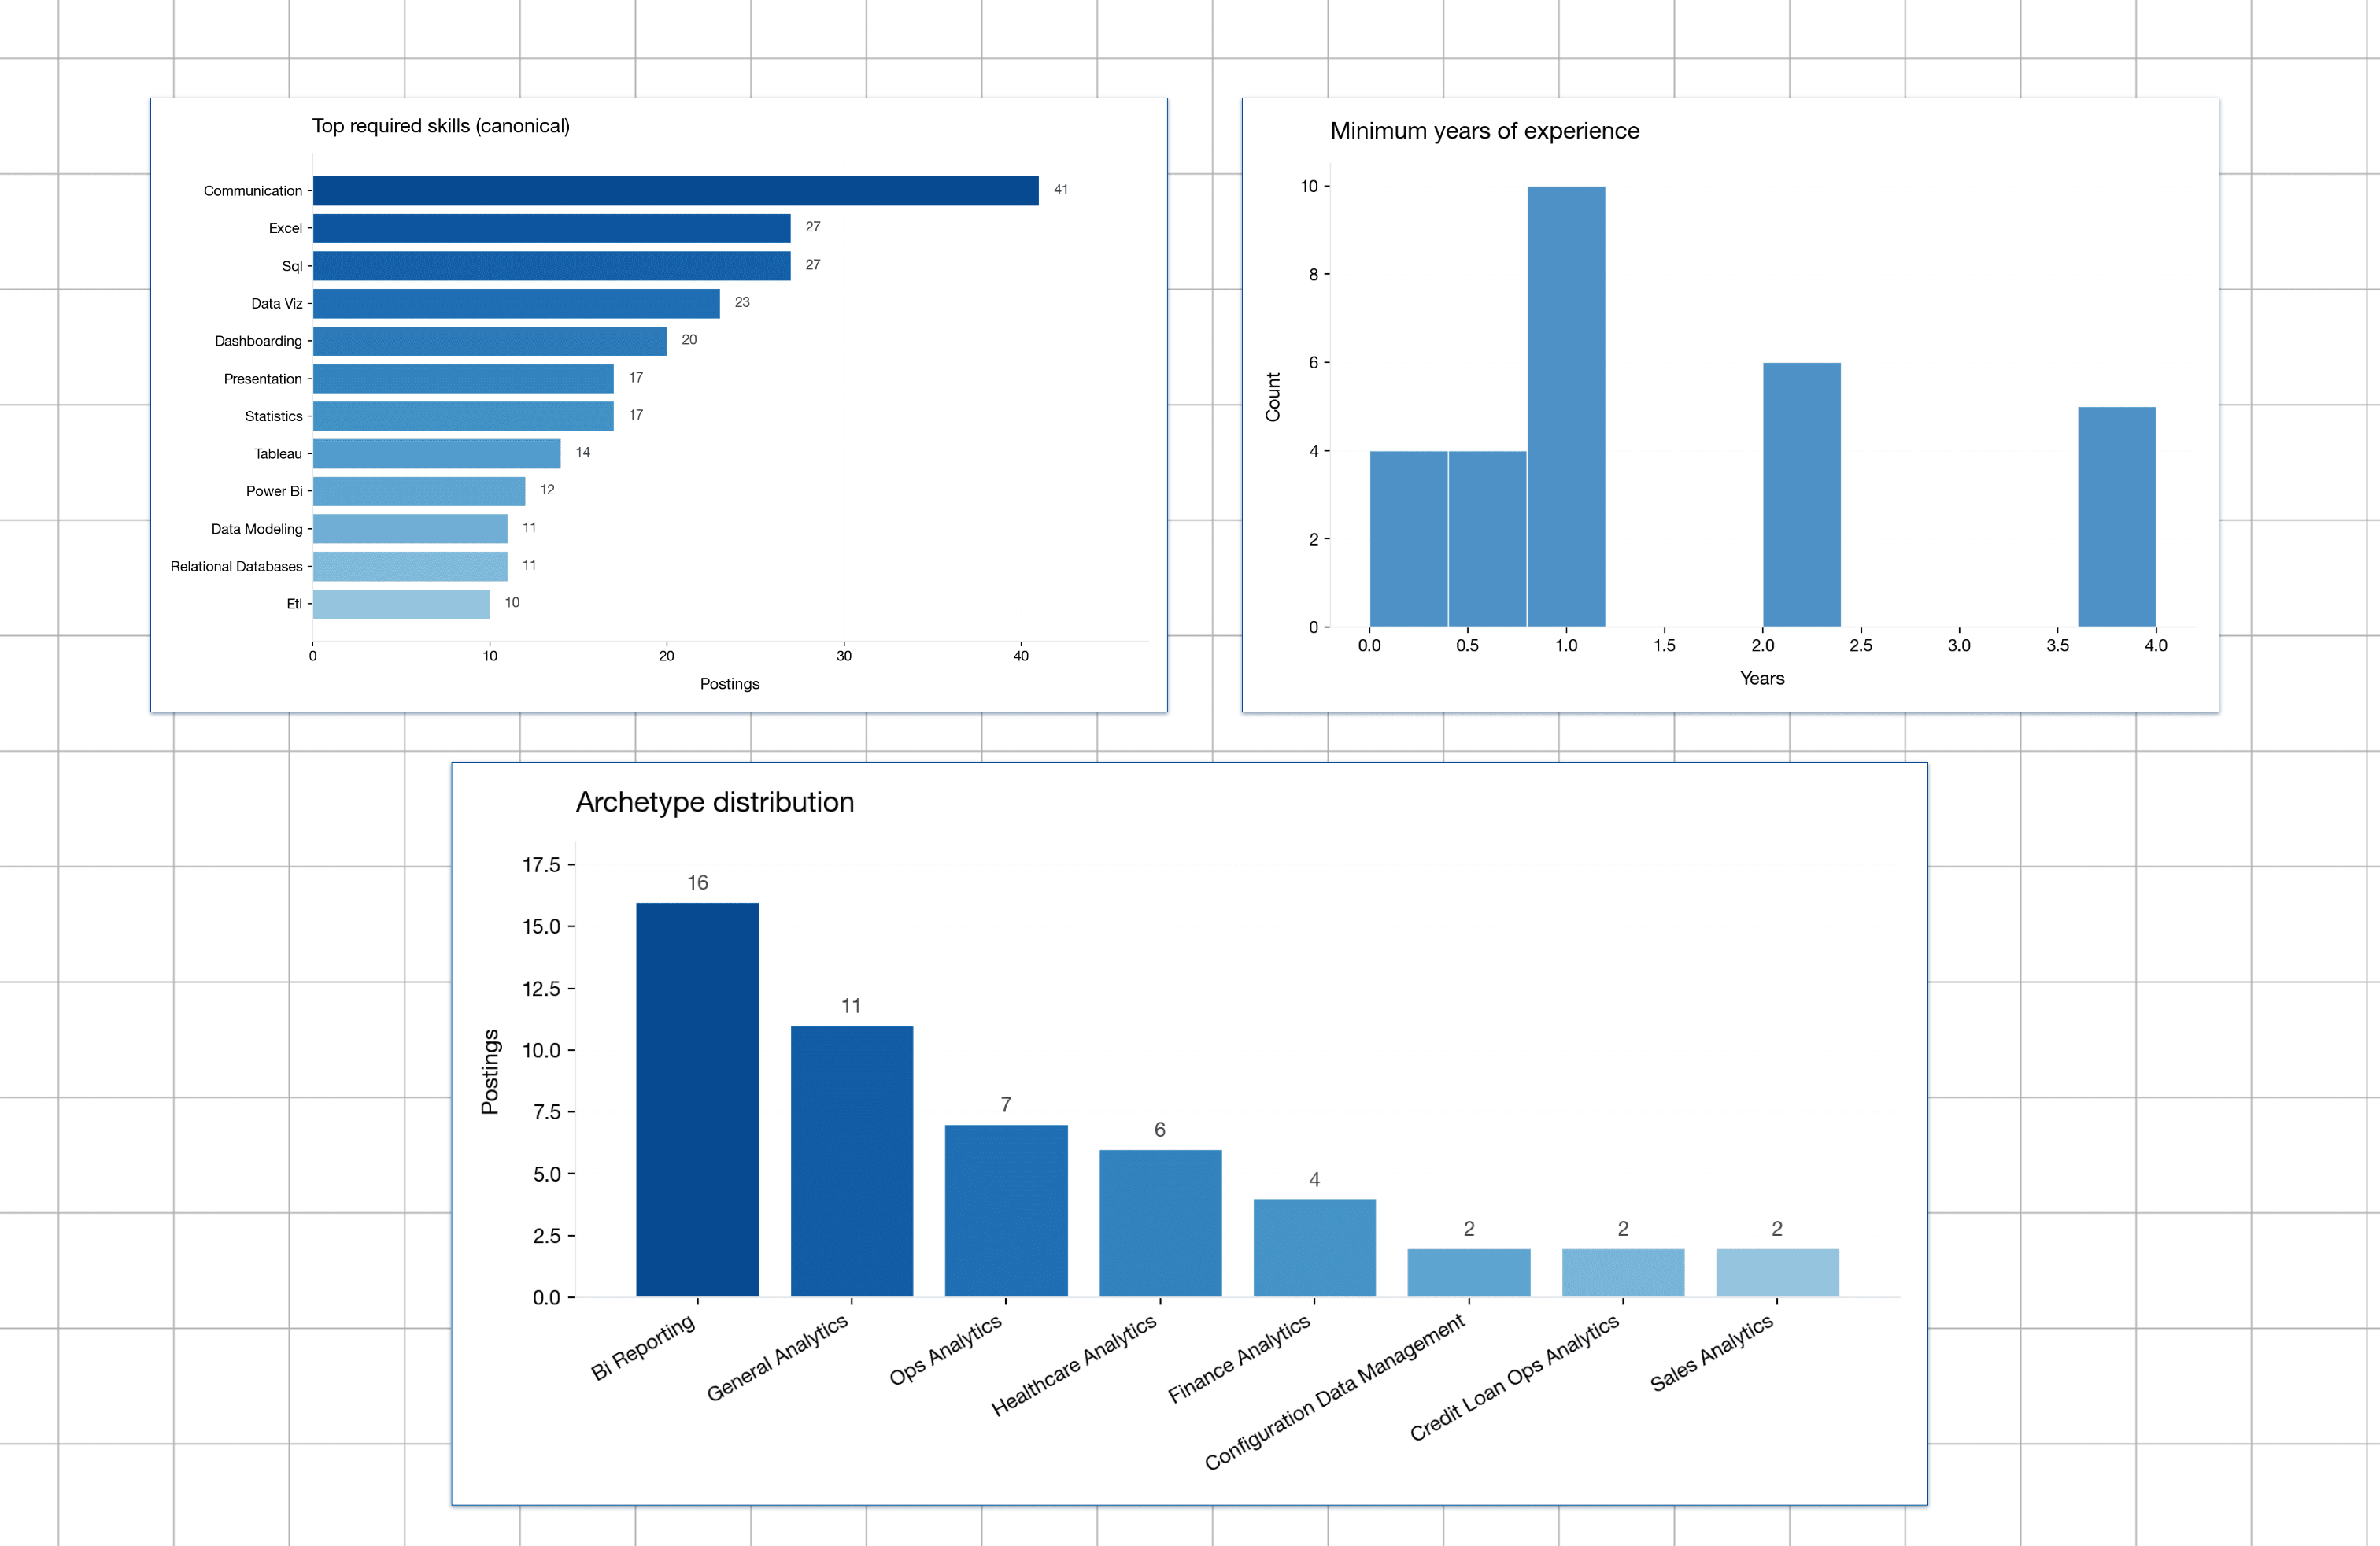
Top required skills (share of postings)
- Communication: 82%
- Excel: 54%
- SQL: 54%
- Data visualization: 46%
- Dashboarding: 40%
- Presentation: 34%
- Statistics: 34%
- Tableau: 28%
- Power BI: 24%
- ETL: 20%
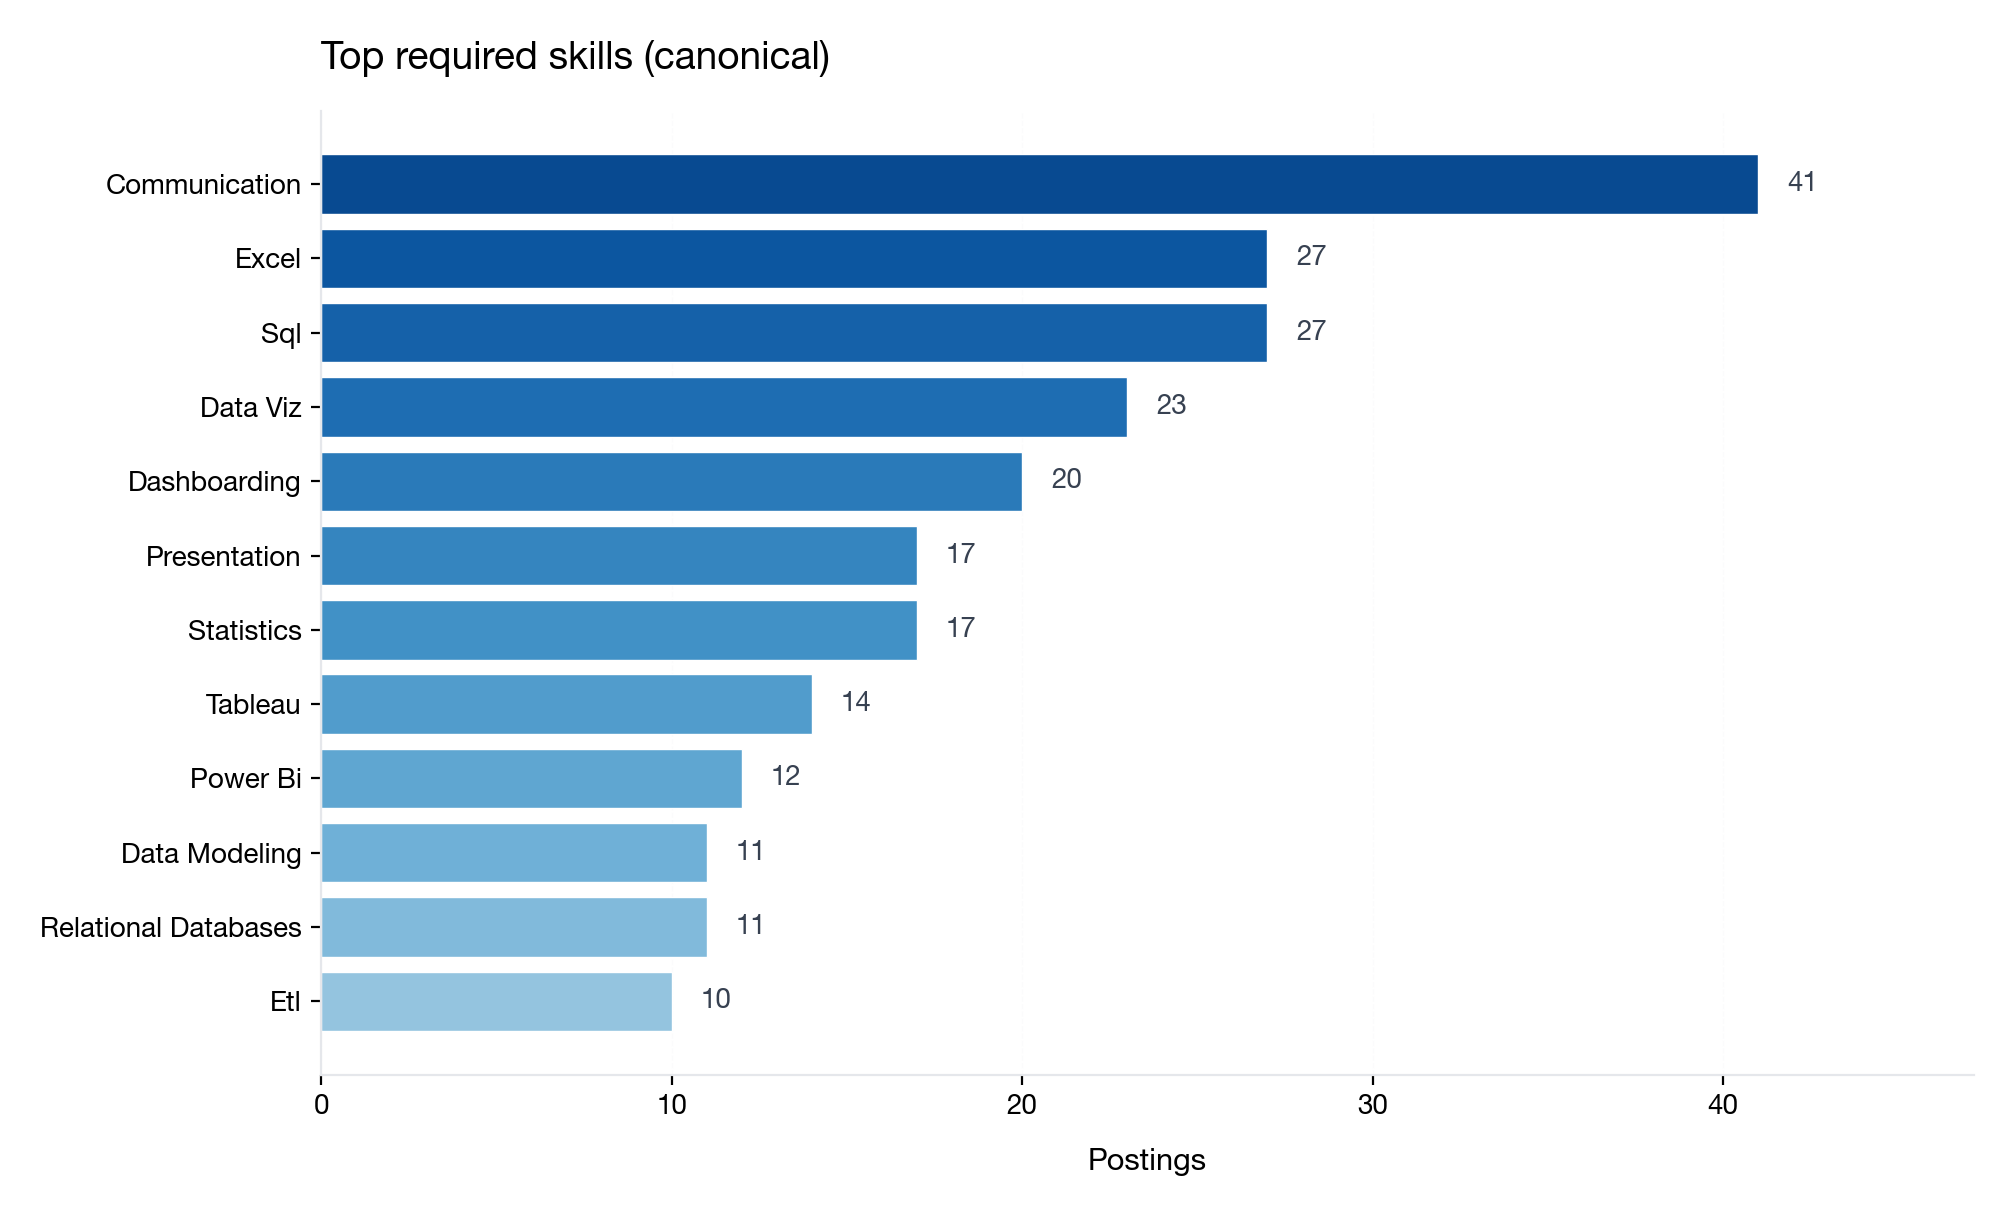
Top required skills
Top preferred skills (share of postings)
- Python: 14%
- SQL: 12%
- Presentation: 10%
- Git / Postgres / Power BI / Statistics / Tableau: 8% each
- Airflow / ERP / Microsoft Access / MS SQL Server: 6% each
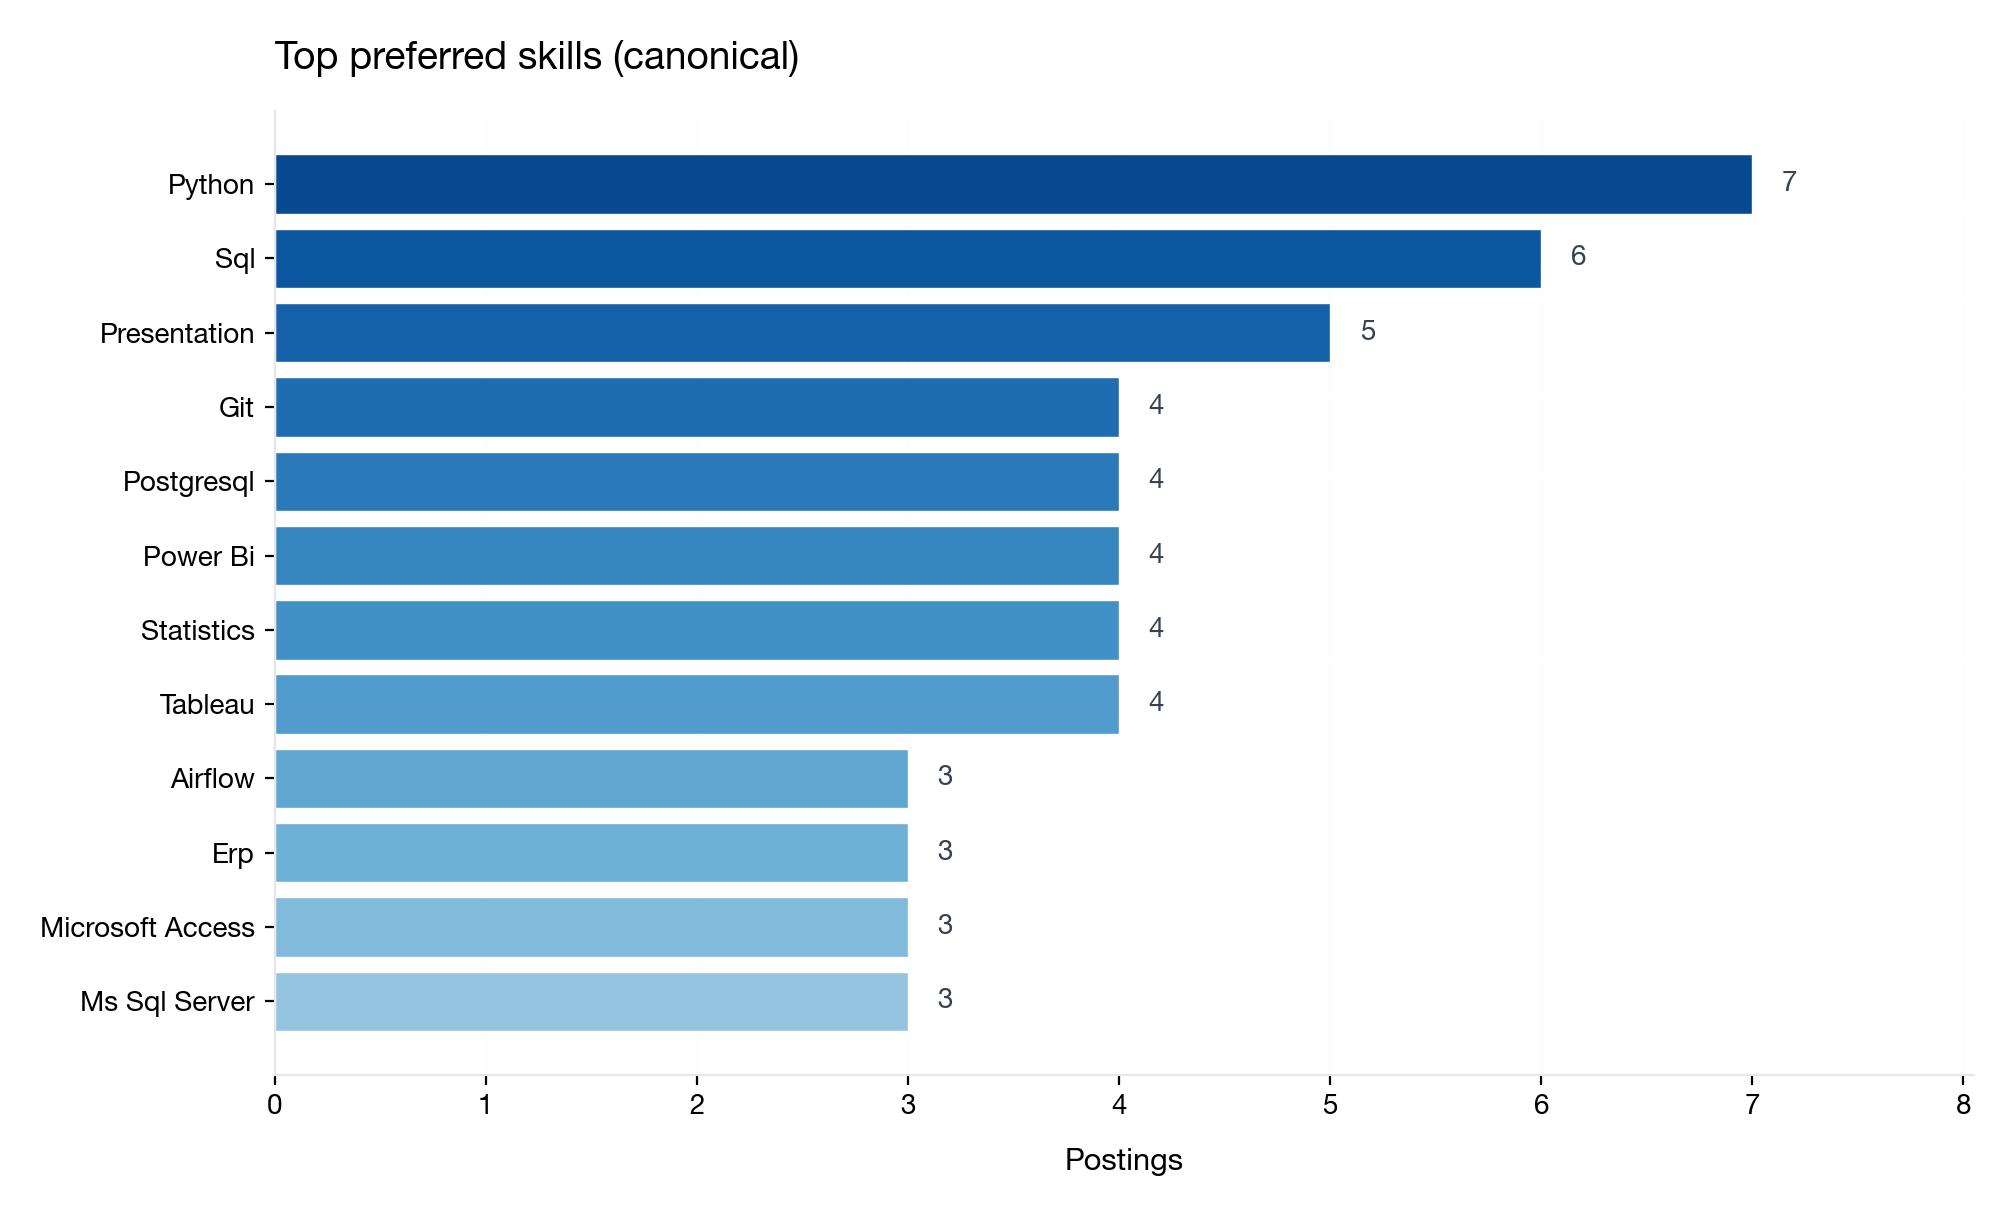
Top preferred skills
Two takeaways:
- Excel + SQL are still the backbone at junior level (in this sample).
- Python is more often a “nice-to-have” than a baseline requirement here (top preferred at 14%; not among the top required skills).
4. Remote vs onsite (and why “remote-only” is a hard filter)
Work mode mentions in postings:
- Onsite: 74%
- Remote: 10%
- Hybrid: 6%
- In-office Tue–Thu, WFH otherwise: 4%
- Remote or hybrid: 2%
- Unknown (not explicitly stated): 4%
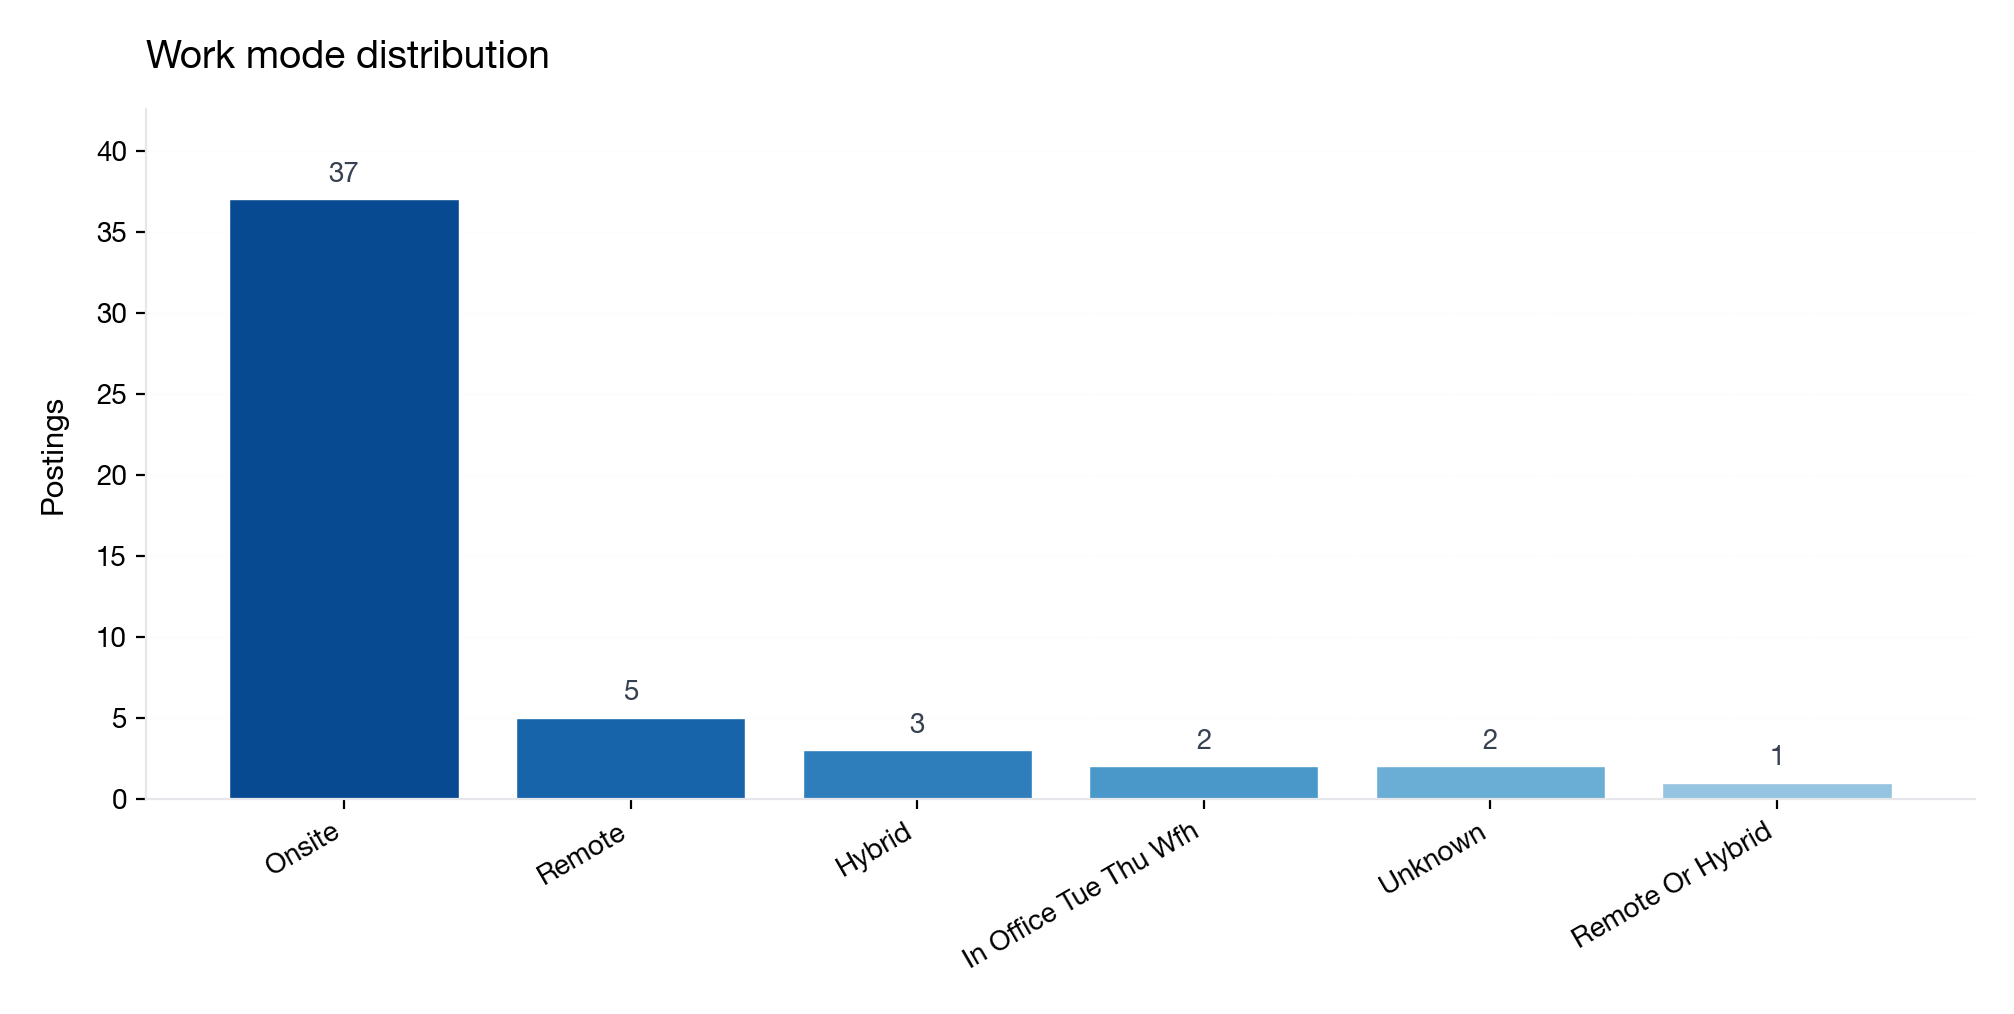
Work mode mentions
Interpretation: In this sample, onsite roles dominated. The practical point is simple: if you apply remote-only, you’re filtering out most postings in this dataset.
5. Location and eligibility (often confused with "remote")
A lot of candidates filter by "remote," but postings often constrain where and who can work as well.
- Local-only: 80% (must be in/near a specific location)
- US-only (anywhere in the US): 6%
- Unknown location constraint: 14%
Work authorization / sponsorship signals (when stated):
- None stated: 52%
- US work authorization required: 26%
- US citizen only / citizen+GC: 8% combined
- Visa sponsorship explicitly not offered: 22% (78% unknown)
Practical takeaway: Treat remote-only as a strong filter—and separately check eligibility constraints early to avoid wasted applications.
Note: A small minority of postings referenced security clearance requirements.
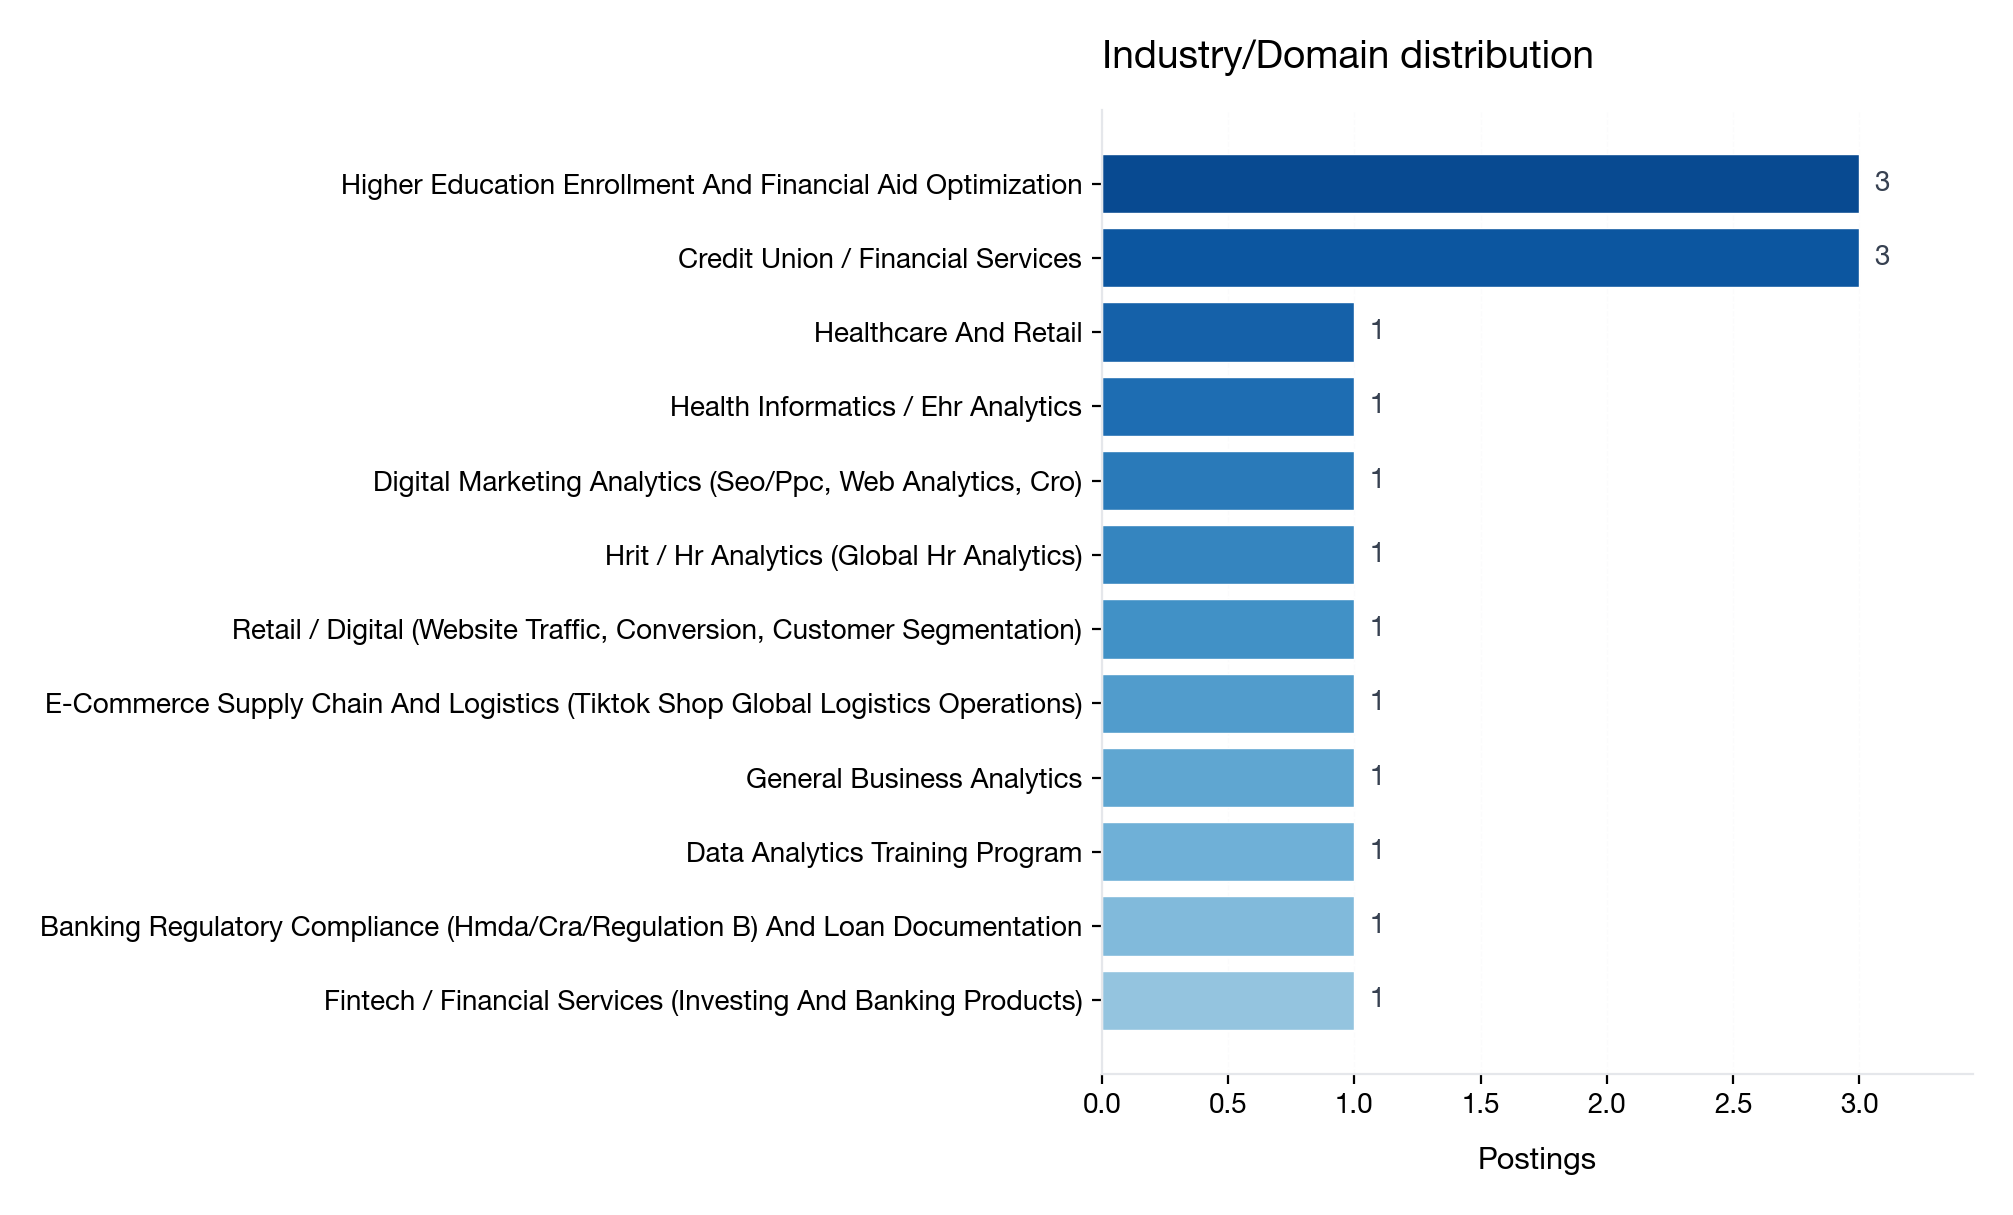
6. Industry/Domain (why this looks long-tail)
We also extracted a domain label from each posting when it was explicit (e.g., higher ed enrollment, credit unions, marketing analytics).
Two caveats:
- Domain shows up as a long tail (many one-off labels), because job posts describe industries in very different words.
- The right way to use domain is not “filter harder” — it’s to choose better project datasets and craft a stronger interview narrative.
What we saw in this sample
- Higher education enrollment / financial aid optimization: 6%
- Credit union / financial services: 6%
- Everything else was single-posting long tail (2% each), plus a small UNKNOWN bucket.
How to use this (practical)
If you’re targeting a domain (healthcare, finance, marketing, higher ed), keep your core deliverables the same:
- SQL + KPI definitions
- Dashboard + a 1-page memo
- QA checks (grain/joins/dedup/null handling)
…but swap the dataset and business questions to match the domain you see in your target job posts.
7. What do they expect you to produce?
Deliverables mentioned (share of postings):
- Dashboards: 34%
- Reports: 16%
- Smaller recurring items included ongoing/custom reports, PowerPoint presentations, documentation, data extracts, and cleansed datasets prepared for downstream analysis.
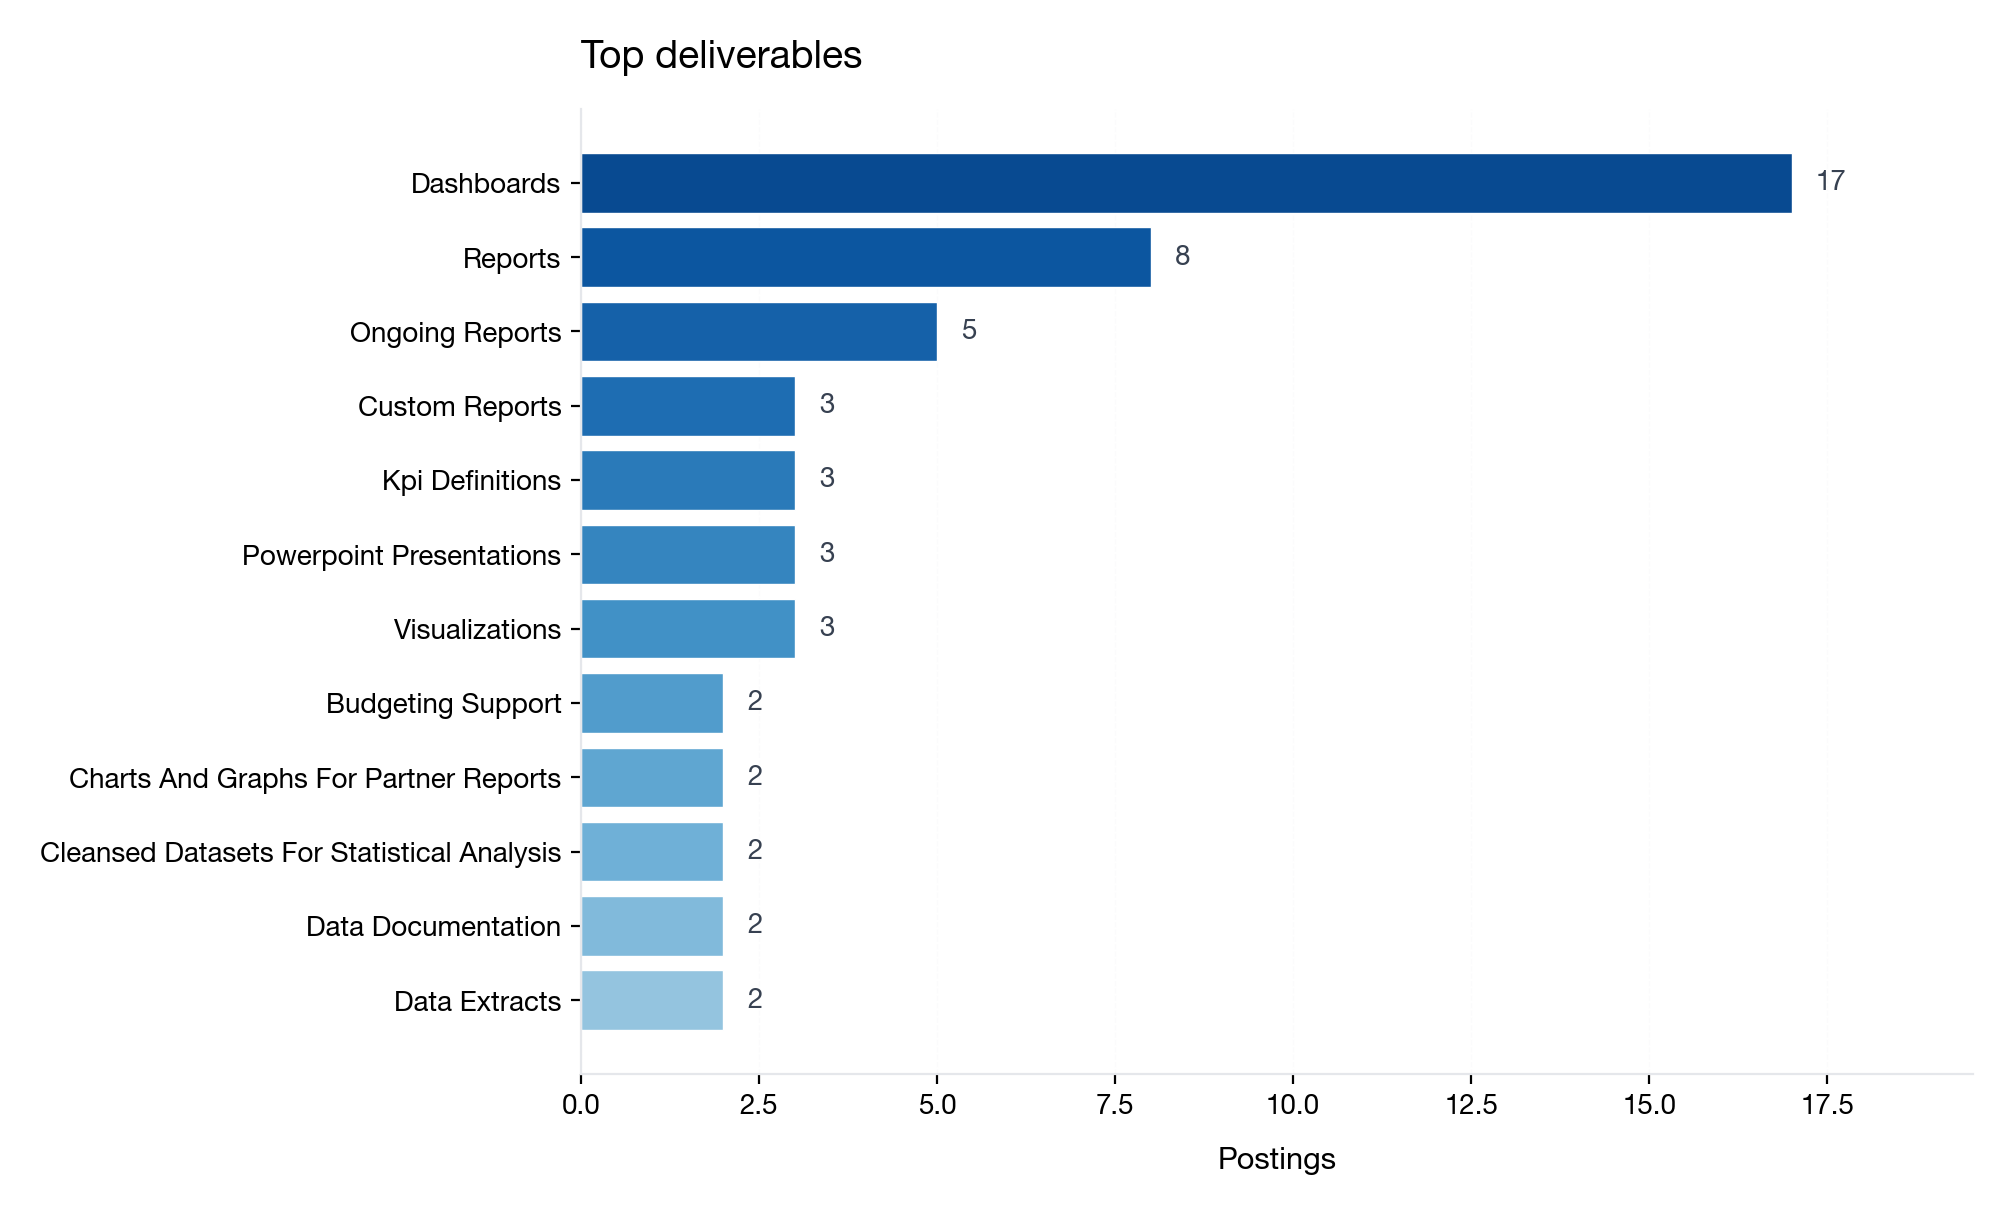
Most mentioned deliverables
Note on dashboards: We tracked "dashboards" both as a work activity (64% in analysis types) and as an explicit deliverable term (34% here). Many job descriptions describe dashboarding as a responsibility but don't list "dashboard" under explicit outputs. Both metrics are valid but measure different aspects.
If you’re building a portfolio, this is the most practical hint: employers keep describing outputs, not “topics.”
8. Education and experience signals
Education
- Bachelor’s listed: 66% of postings (28% didn’t specify).
- Education was explicitly required in 52% of postings; another 26% accepted equivalent experience.
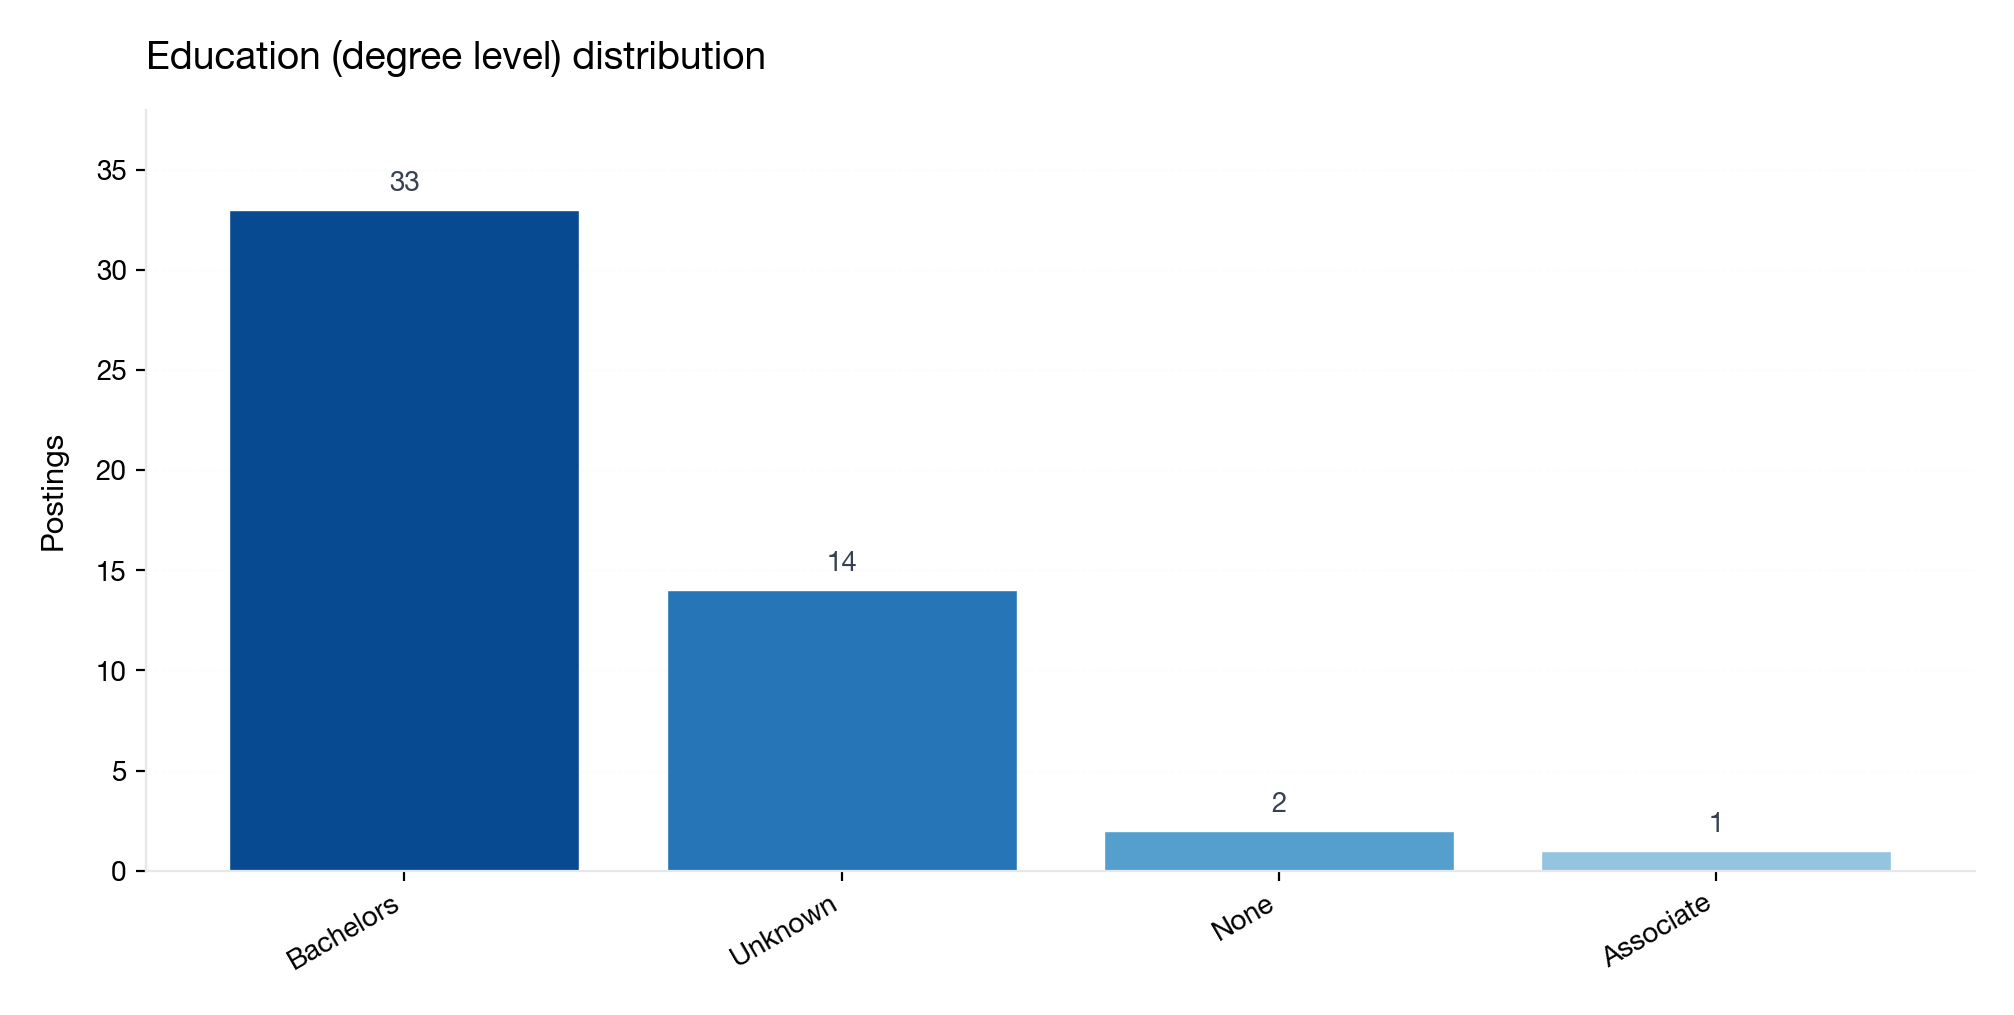
Education (degree level) mentions
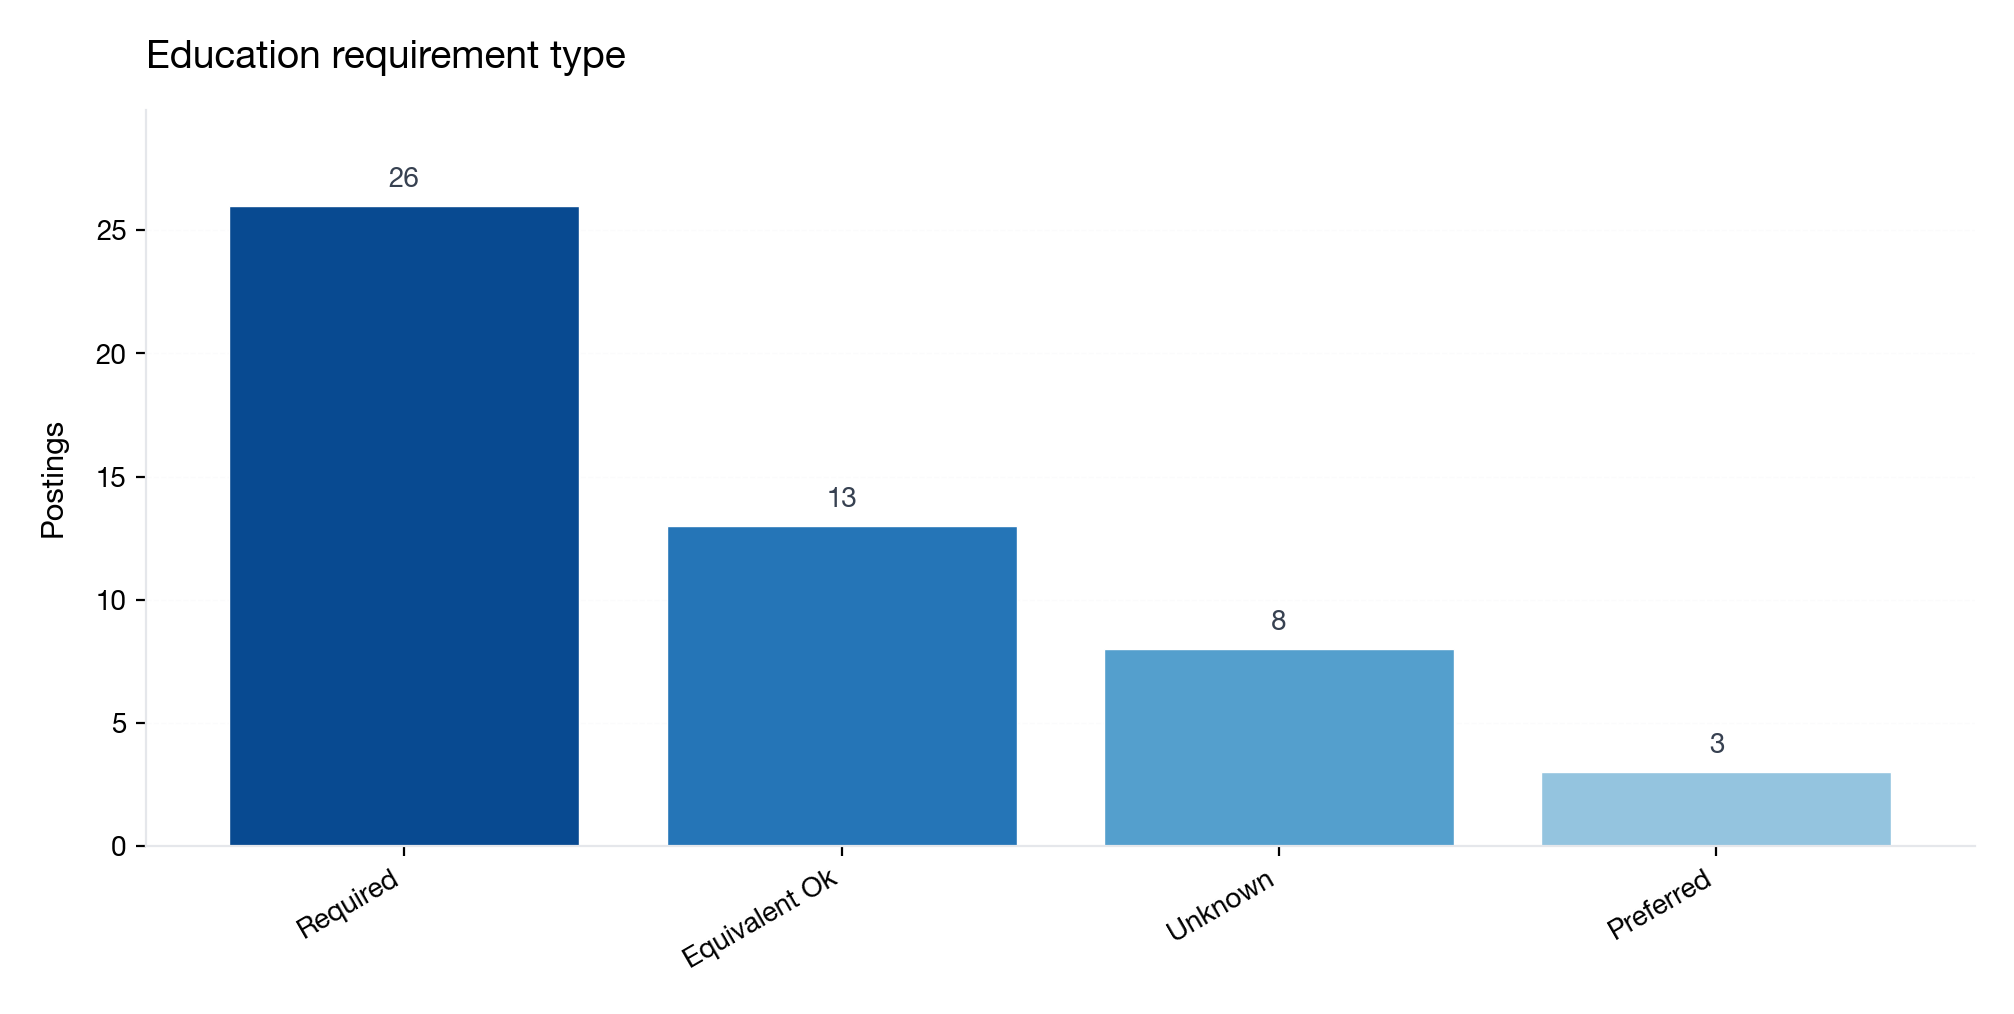
Education requirement type
Experience
- Experience was explicitly required in 56% of postings (28% unknown; others preferred or equivalent ok).
- Experience years were explicitly mentioned in 29/50 postings; median minimum was 1 year.
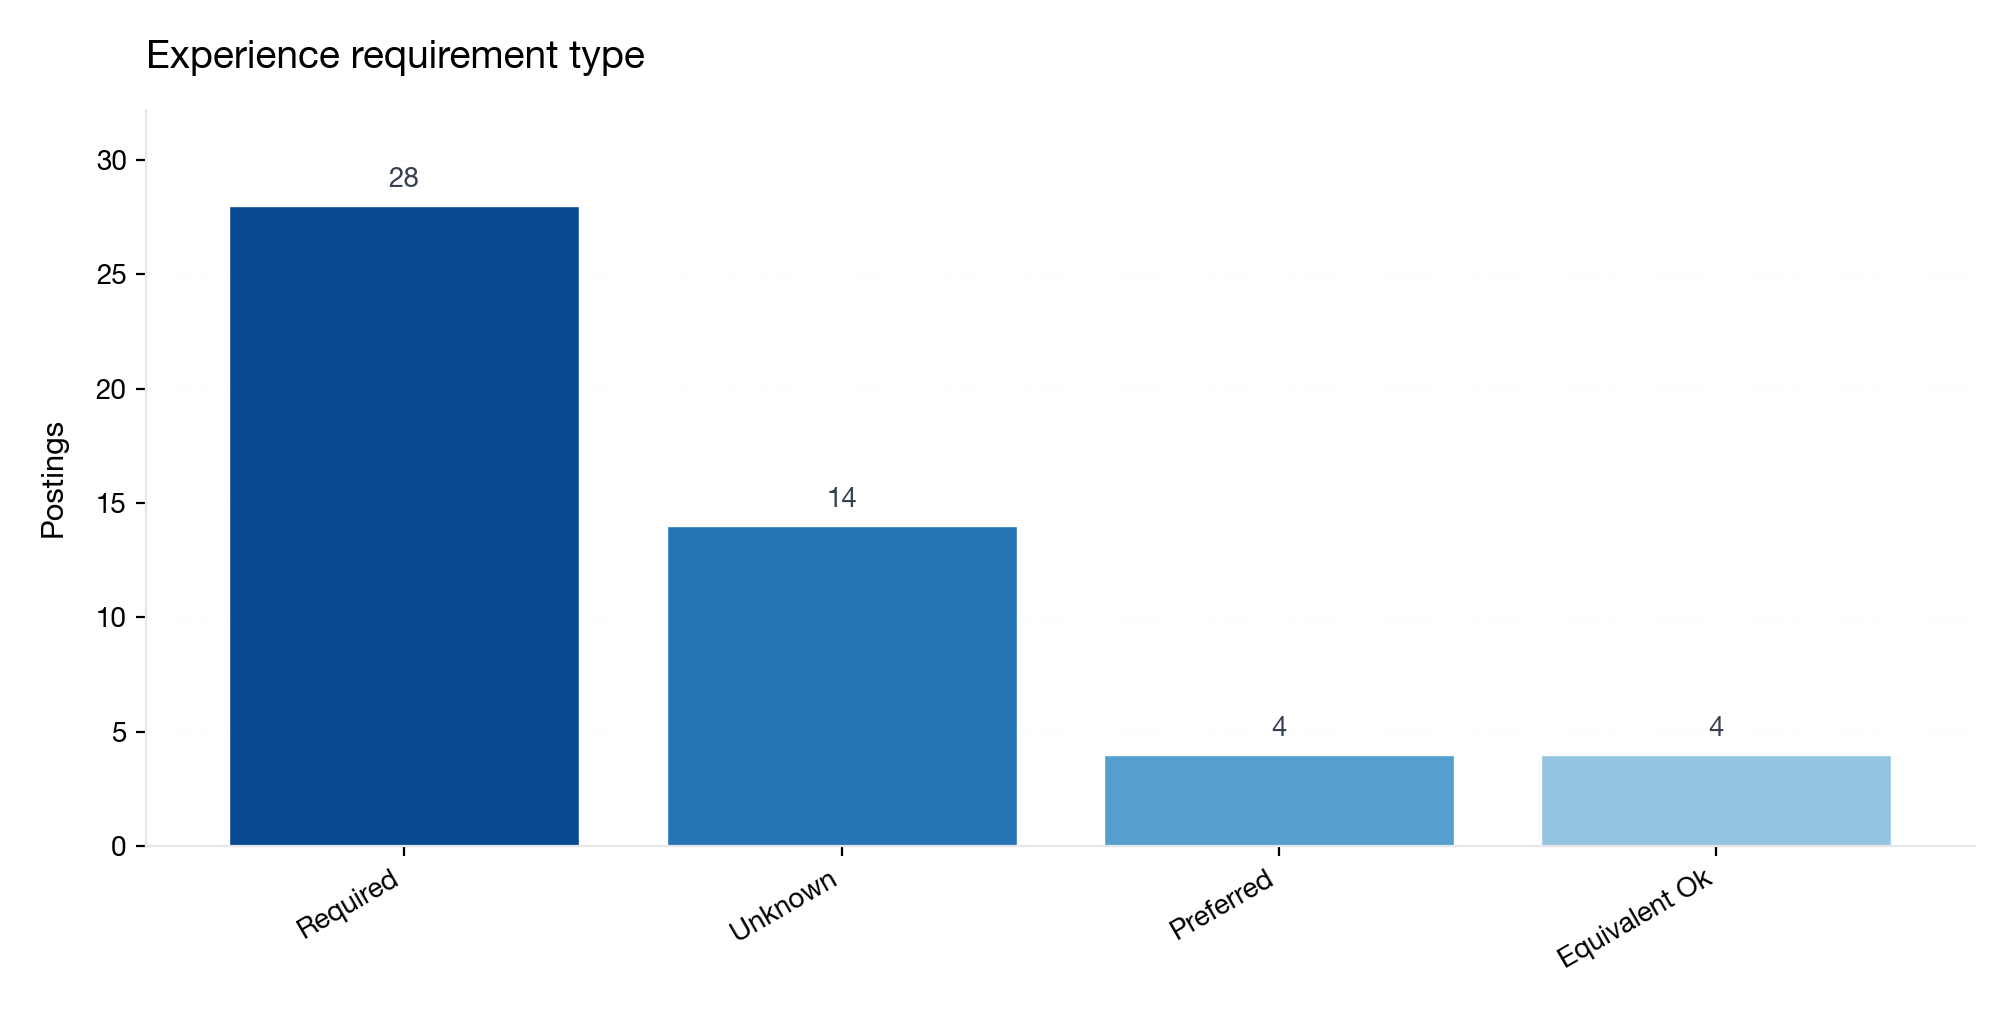
Experience requirement type
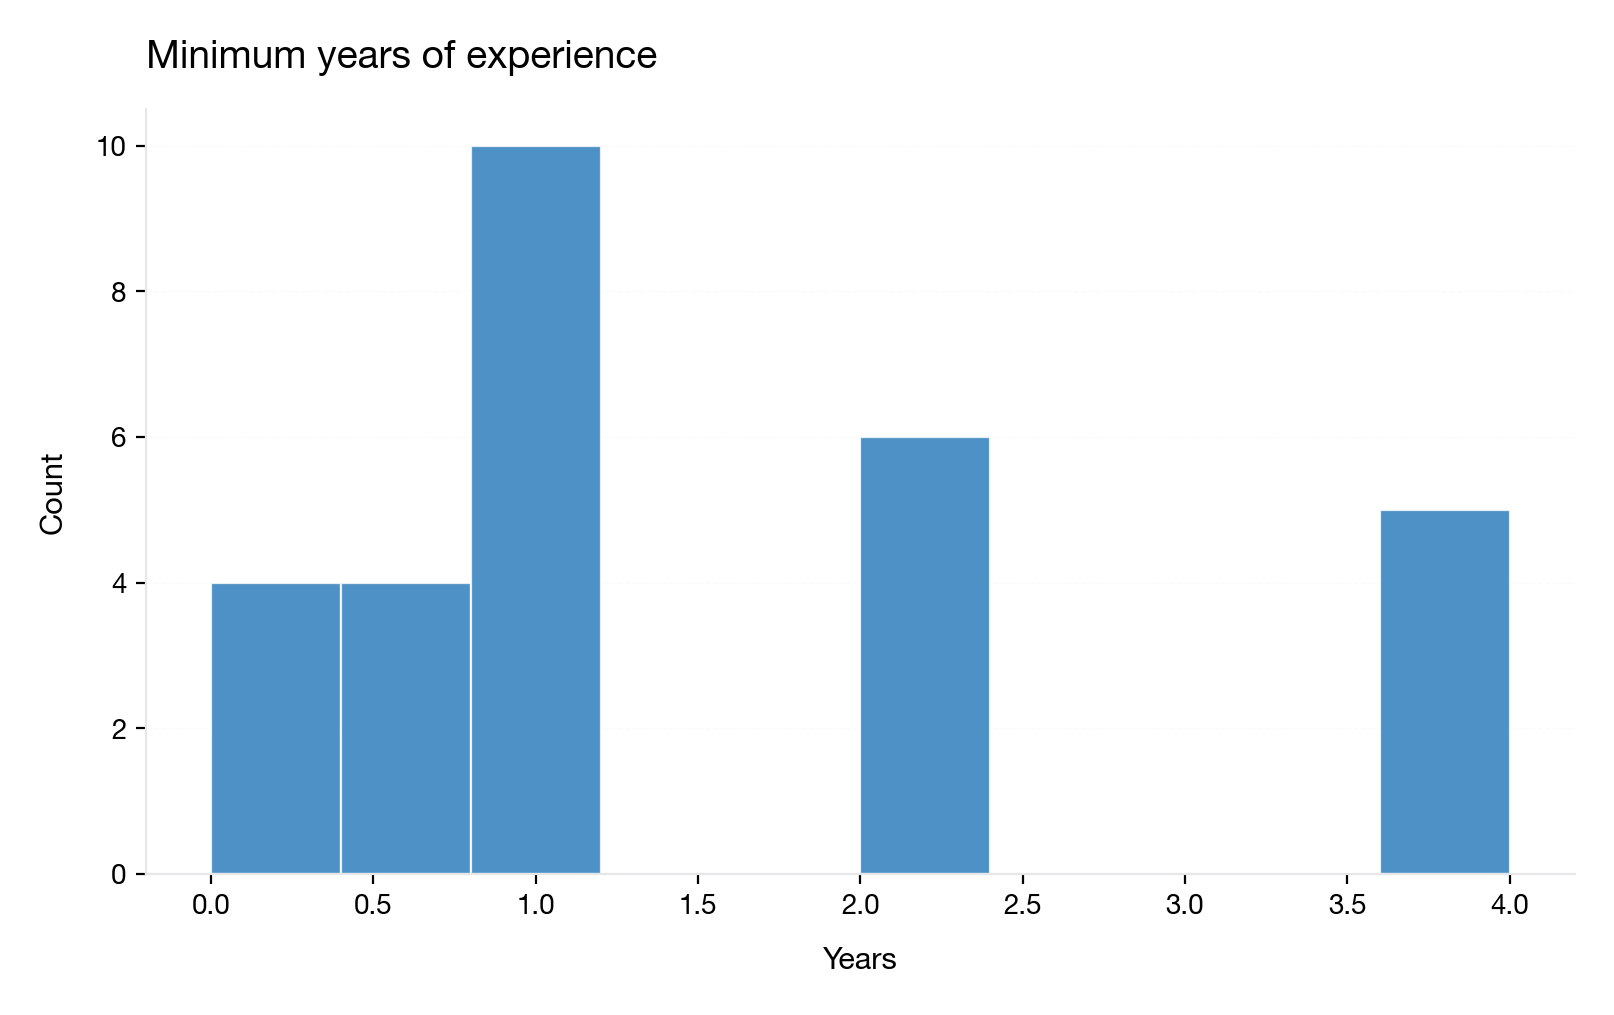
Experience years (minimum) where specified
9. What to do with this (a practical 4–8 week plan)
If you’re applying for junior DA roles soon, the most “aligned” loop looks like:
- Pick 3–5 postings you’d realistically apply for (same level).
- Map must-haves (Excel, SQL, dashboards, reporting hygiene).
- Build deliverables that hiring managers can evaluate quickly.
A simple 4-week plan (minimum viable)
- Week 1: SQL refresh + Excel refresh + set up a repo + write a QA checklist (joins, grain, duplicates, nulls).
- Week 2: Choose one dataset → define KPIs → draft dashboard v1.
- Week 3: Improve data quality + add documentation + write a 1-page insight memo.
- Week 4: Do a second project scoped to your target domain (healthcare/finance/ops), and turn it into an interview story.
Then iterate (weeks 5–8): add one “nice-to-have” (Python/stats), polish, mock interviews.
The minimal portfolio spec (what hiring managers recognize)
- 1 dashboard (Tableau, Power BI, or Looker) with clear KPIs
- KPI documentation (definitions, data sources, calculation logic)
- Data quality checks (grain validation, join tests, duplicate detection, null handling)
- 1-page insight memo (business question, findings, recommendations)
- Reproducible repo (SQL scripts, pipeline notes, README with setup instructions)
Q&A
APA: Noetify Team. (2026, January 23). Junior Data Analyst roles in the US: what 50 job posts mentioned most (Jan 2026). Noetify. https://www.noetify.app/blog/junior-data-analyst-roles-in-the-us-jan-2026
Each percentage is post-level: (# of postings that mention the item at least once) / 50.
Each posting counts once per item (even if it mentions it multiple times).
We canonicalize common variants (e.g., "Power BI", "PBI").
This is a small snapshot (n=50) of a moving market. Results depend on where postings were sourced from and how roles are titled. Extraction is LLM-based; we did a small manual audit and results remain approximate. Treat these numbers as directional, not definitive.
We don't publish job description text or a raw postings dump. We share only aggregated counts, charts, and methodology.
If you want to turn these insights into a job-specific plan, you can generate a free preview below.